How do you read an ECG?
This is a summary of the 7 steps of ECG (electrocardiogram) interpretation.
- Rate
- Rhythm (includes P wave)
- Axis
- PR interval
- QRS complex
- ST segment
- T wave.
Let’s start with some basics.
 Normal ECG impulse
12 ECG leads look at the heart from 12 directions, in 2 planes: 6 standard/limb (vertical) leads; 6 chest (horizontal) leads
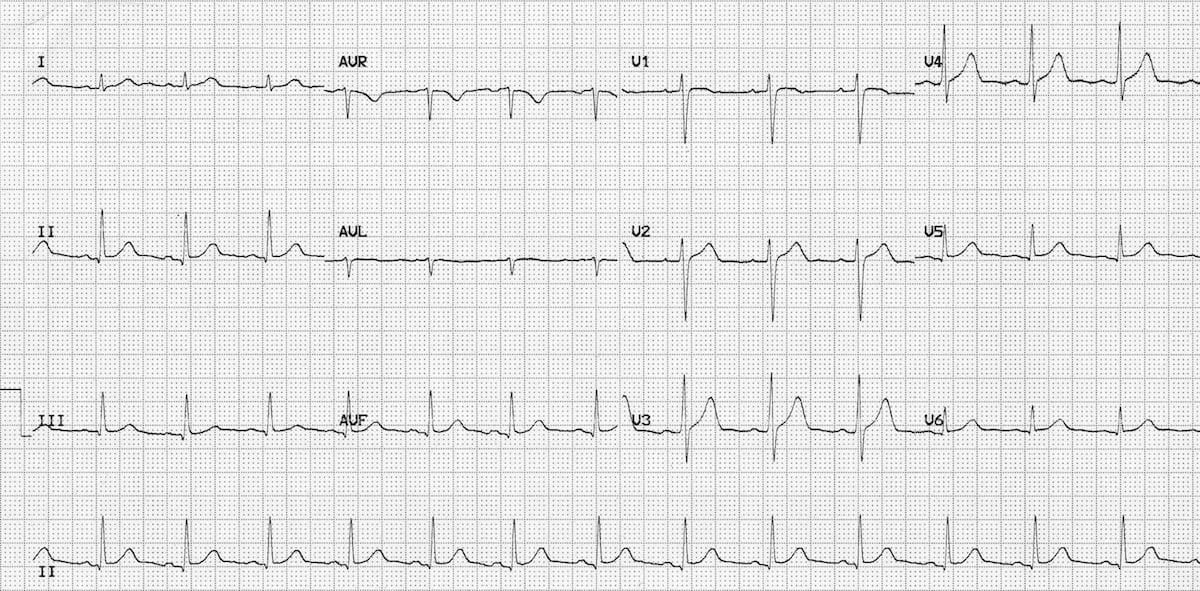
A normal ECG. The longer version of II at the bottom is called the ‘rhythm strip’.
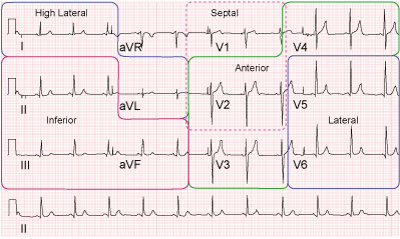 ECG regions of the heart
1. Rate
- Tachycardia or bradycardia?
- Normal rate is 60-100/min.
2. Rhythm – regularity of QRS complexes and presence/absence of P waves
- Normal regular (sinus) rhythm, or irregular?
- If irregular, is it regularly irregular or irregularly irregular?
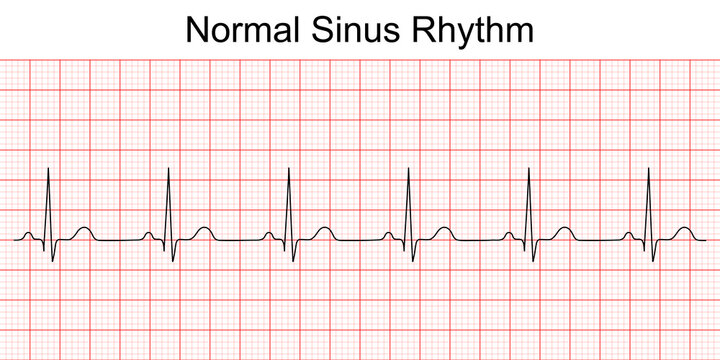
Top Tip: Rate and rhythm: use one lead to examine them – e.g. lead II if you have a 12 lead ECG. There may be a lead II rhythm strip – use that if there is one.
P waves
A normal P wave is present and upright, and <2.5 mm (2.5 small squares) high and <3 mm (3 small squares) wide
- Present: sinus rhythm
- Absent: atrial fibrillation (AF) (usually).
Note. If P waves are absent and there is an irregularly irregular rhythm, it suggests atrial fibrillation; which can have a normal ventricular rate, or be a tachycardia (‘fast AF’) or bradycardia (‘slow AF’).
 Atrial fibrillation
3. Axis
- Normal Axis = QRS axis between -30° and +90°
- Left Axis Deviation = QRS axis less than -30°
- Right Axis Deviation = QRS axis greater than +90°.
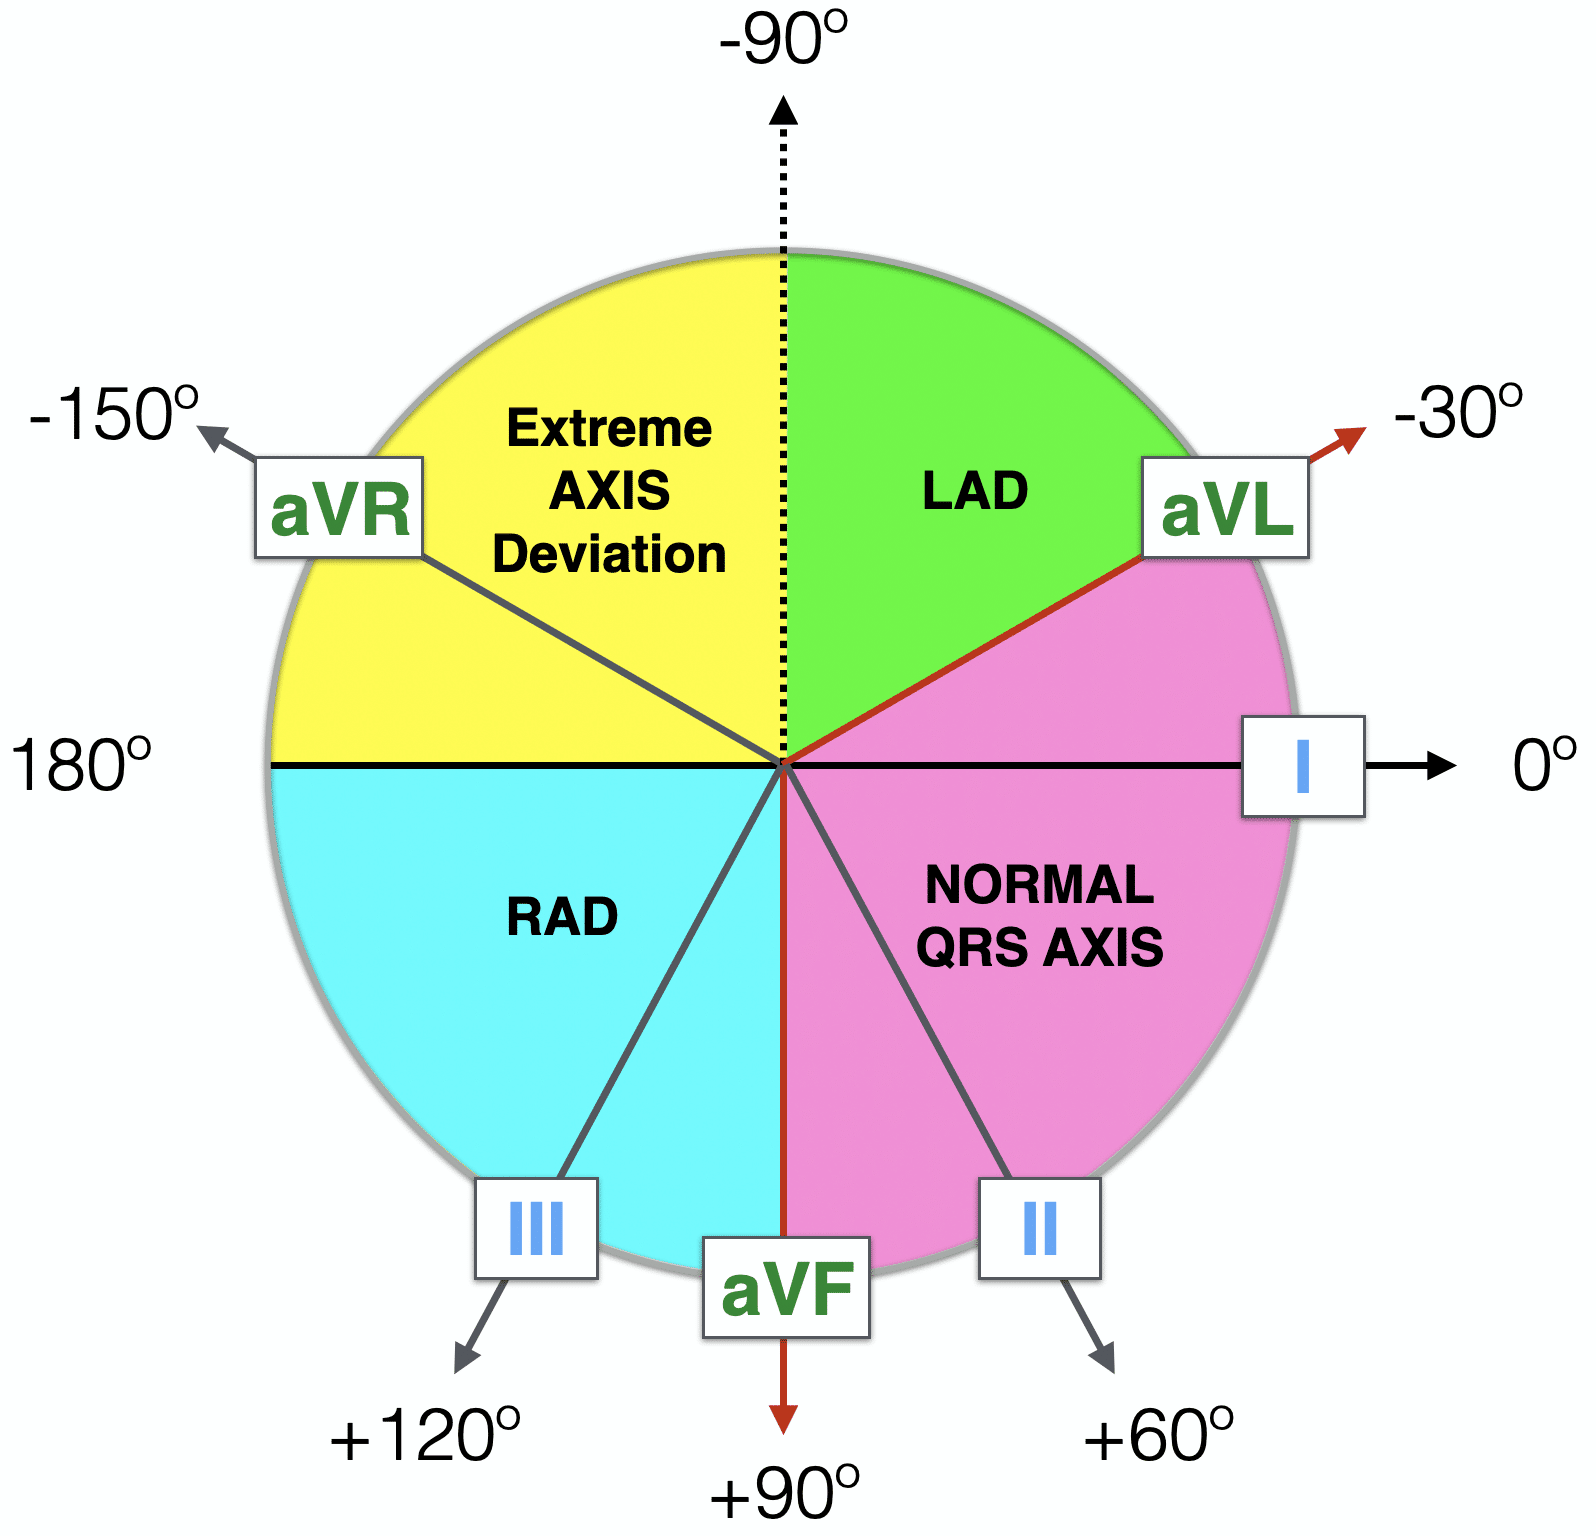
How to calculate the heart axis – vector method
There are lots of ways of calculating the axis. MyHSN likes the ‘vector method’ as it leads to an actual number e.g. ‘+60 degrees’ not just normal, LAD or RAD etc. How its done it a little strange and requires some theoretical (invented!) maths.
- Measure lead I’s ‘overall height’ (i.e. peak of R – depth of S, in small squares (mm)). This can be a positive (usually) or negative number. This number becomes the value on the x axis in the (theoretical) nomogram below
- Measure lead aVF’s ‘overall height’ (R-S in mm). This can be a positive (usually) or negative number. This number becomes a value on the y axis in the (theoretical) nomogram below. But a positive number is represented as negative number in the nomogram. Odd maths (yes!)
- Put both (theoretical) numbers into the nomogram below, and Z is the axis of the heart.

Worked example (normal ECG above)
R-S in lead I = +3 mm, and in AVF = +6 mm. So axis is about +60 degrees.
4. PR interval
Normal PR interval = 3-5mm (5 small squares). You are looking for:
- First degree heart block
- Second degree heart block
- Third degree (‘complete) heart block.
5. QRS
Q waves
A small Q wave (2 mm (2 small squares or less) is present and downward in most leads (except V1-3, where they are always pathological). Several large q wave often indicates a previous MI. A large Q wave in III can indicate a PE if there are other typical findings.
QRS complex
Width
Normal = <3mm (3 small squares).
- Narrow complex (normal): electrical impulse is sinus, atrial or junctional (supraventricular) in origin
- Wide complex: ventricular in origin.
Height
Normal = <5mm (5 small squares) in the standard (limb) leads or <10 mm in the chest leads.
- Normal height
- Tall complexes: imply ventricular hypertrophy.
6. ST section
A normal ST section is flat and on the isoelectric line.
- Elevated – myocardial infarction
- Depressed – myocardial ischaemia.
Note 1. ST-elevation is significant when ≥1 mm (1 small square) in 2 or more contiguous (next to each other) standard (limb) leads or ≥ 2mm in 2 or more chest leads. It is most commonly caused by acute full-thickness myocardial infarction.
Note 2. ST depression ≥0.5 mm in ≥ 2 contiguous leads indicates myocardial ischaemia.
7. T waves
A normal T wave is present and most are upright (I, II, aVF, aVL, and V2-6).
- Upright: most are upright
- Inverted:
- aVR: Always inverted.
- V1: Sometimes inverted.
- III: Sometimes inverted.
Note. Normal Q-T Interval: = 9-11 mm (small squares).
Finally .. look for some elephants
Familiarise yourself with normal ECG patterns and variants. When you know these, you can spot the elephants (patterns, i.e. classical ECGs) described below.
Elephant 1. Inferior MI
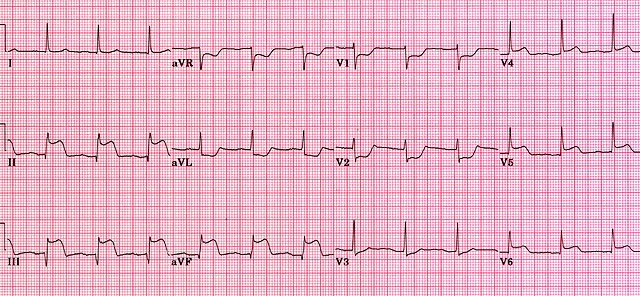
Inferior MI (ST elevation in II, III and aVF)
Elephant 2. Anterior MI

Anterior MI (ST elevation in V2-5)
Elephant 3. Pulmonary embolism (PE)
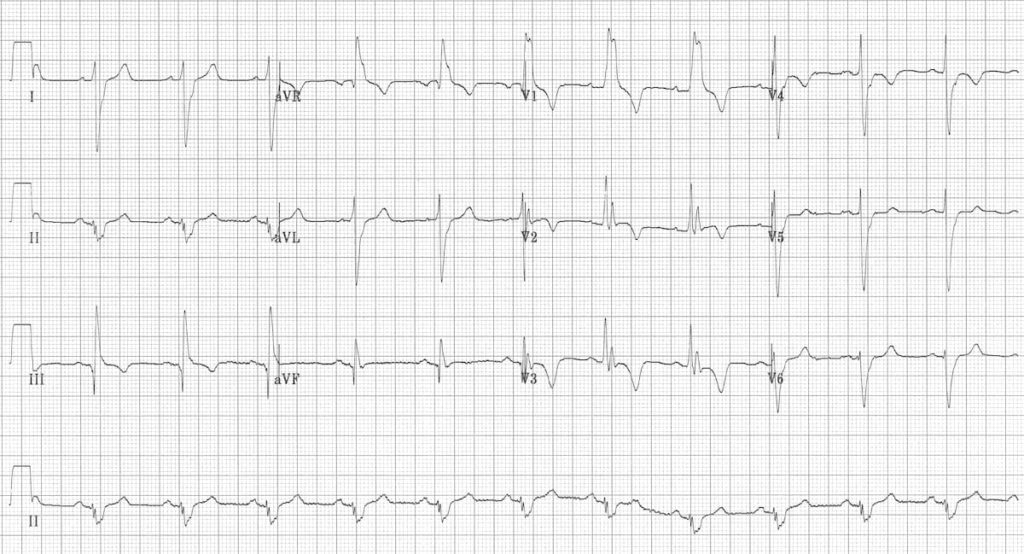
- All the ‘rights’
- RBBB
- Right axis deviation (extreme; +180 degrees)
- Right ventricular strain – T-wave inversions in V1-4 and lead III.
- ‘S1 Q3 T3’. This means a deep S in I, a deep Q and inverted T in III.
Note. These findings usually only occur in massive PE. A typical ECG in PE is normal or shows sinus tachycardia.
Elephant 4 – Left and Right Bundle Branch Block (LBBB/RBBB)
The WiLLiaM MaRRoW mnemonic can be used to quickly recognise left and right bundle branch blocks by looking at V1 and V6.
The middle letters of the names help you remember which bundle branch block each name is referring two (two Ls in WiLLiaM = left bundle branch block, two Rs in MaRRoW = right bundle branch block).
Each name’s first and last letter helps you recognise the ECG features of the associated bundle branch block.
- LBBB: deep S wave in V1 which may be notched (“W”) and broad “M” shaped R wave in V6
- RBBB: RSR’ pattern in V1 (“M”) and broad S wave in V6 (“W”).
Note. There are other elephants in the 10 most common ECG patterns you should know video below.
How to present an ECG (Elephant 1 above)
“This is an ECG of Mr/Mrs X taken Y. The rate in 75 beats per minute, the rhythm is sinus, the axis is normal at 45 degrees. The P waves, PR interval and QRS complexes are normal. There is ST elevation in standard leads II, III and aVF. The diagnosis is an acute ST elevation inferior myocardial infarction.”
Note. There are also biphasic inverted T waves in aVR, aVL and V1-2.
Other resources
Basic principles of the ECG
How to read an ECG (Geeky Medics)

