Basic principles of the ECG
Introduction
 Normal ECG impulse
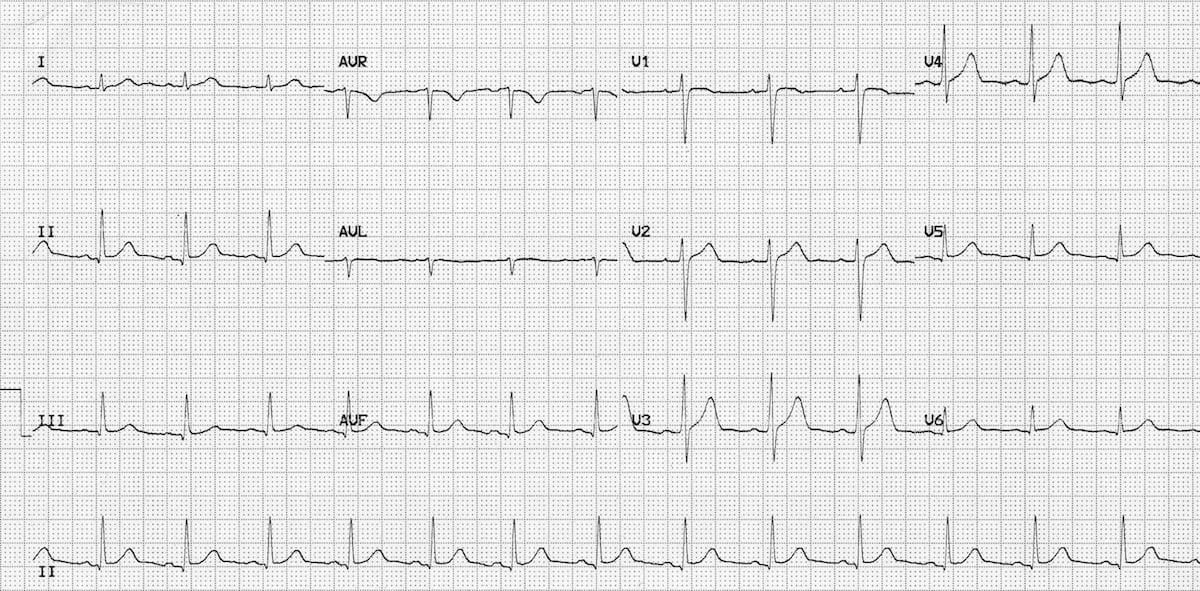
The 12 ECG leads look at the heart from 12 directions, in 2 planes: 6 standard/limb (vertical) leads; 6 chest (horizontal) leads

A normal ECG. The longer version of II at the bottom is called the ‘rhythm strip’.

ECG regions of the heart (see below)
Clinical uses
-
Diagnosing arrhythmias: Atrial fibrillation (AF), supraventricular tachycardia (SVT)
-
Detecting ischaemia: ST-segment changes
-
Monitoring therapy: Pacemakers, anti-arrhythmic medication
-
Pre-operative screening: Identifying underlying cardiac conditions.
Basic principles
-
P-Wave: represents atrial depolarisation, indicating atrial contraction
-
QRS Complex: ventricular depolarisation, marking ventricular contraction
-
T-Wave: ventricular repolarisation, preparing for the next contraction
-
P-Q Interval: Time between atrial and ventricular depolarisation
-
Q-T Interval: Time between ventricular depolarisation and repolarisation.
ECG components
-
Rate: calculated by dividing 300 by the number of large squares between R-waves
-
Rhythm: regularity of R-R intervals
-
Axis: direction of ventricular depolarisation (normal, left, right axis deviation)
-
Voltage: amplitude of ECG complexes.
Normal ECG values
-
Heart rate: 60-100 bpm
- P wave: <2.5 mm (2.5 small squares) high and <3 mm (3 small squares) wide
-
P-R Interval: 3-5 mm (small squares)
- Q: <2 mm (small squares) high
-
QRS Duration: <3 mm (small squares) wide
- Q-T Interval: 9-11 mm (small squares).
Cardiac regions (territories)
See diagram above.
Cardiac regions refer to which part of the heart each lead is ‘looking at’.
For example, as leads II, III, and aVF point inferiorly, they assess the inferior part of the heart.
Similarly, leads I, aVL, V5-6 look at the lateral part of the heart (and are therefore called the lateral leads), V1-2 the septal leads, and V3-4 the anterior leads.
- Inferior – II, III, aVF
- Lateral – I, aVL, V5, V6
- Septal – V1, V2
- Anterior – V3, V4.
And each region is characteristically supplied by a specific coronary vessel.
- Inferior – Right coronary artery (RCA)
- Posterior – Right coronary artery (RCA)
- Anterior – Left anterior descending (LAD)
- Septal – Left anterior descending (LAD)
- Lateral – Left circumflex artery (LCA).
Common abnormalities
-
Tachycardia: Heart rate > 100 bpm.
-
Bradycardia: Heart rate < 60 bpm
-
Atrial fibrillation: Irregularly irregular rhythm; which can be bradycardic (‘slow AF’), tachycardic (‘fast AF’) or normal heart rate
-
Ventricular fibrillation: Chaotic, disorganised rhythm
-
Myocardial infarction or ischaemia: ST-segment elevation or depression.
5 Top Tips for ECG interpretation
-
Systematic Approach: Follow a structured 7-step method:
- Rate
- Rhythm (includes P wave)
- Axis
- PR
- QRS
- ST
- T wave
-
Look for elephants: Familiarise yourself with normal ECG patterns and variants to improve recognition of abnormalities
-
Measure, don’t estimate: Accurately measure intervals and segments instead of estimating
-
Consider clinical context: Correlate ECG findings with patient symptoms, medical history and physical examination
-
Practice, practice, practice: Interpret multiple ECGs to develop proficiency and confidence.
Summary
We have described the basic principles of ECG analysis. We hope it has been helpful.

