A normal ECG – the basics
The electrocardiogram (ECG) is a key diagnostic tool in medicine; providing information on cardiac function and structure. But what does a normal one look like? I.e. a normal ECG. Let’s start with some basics.

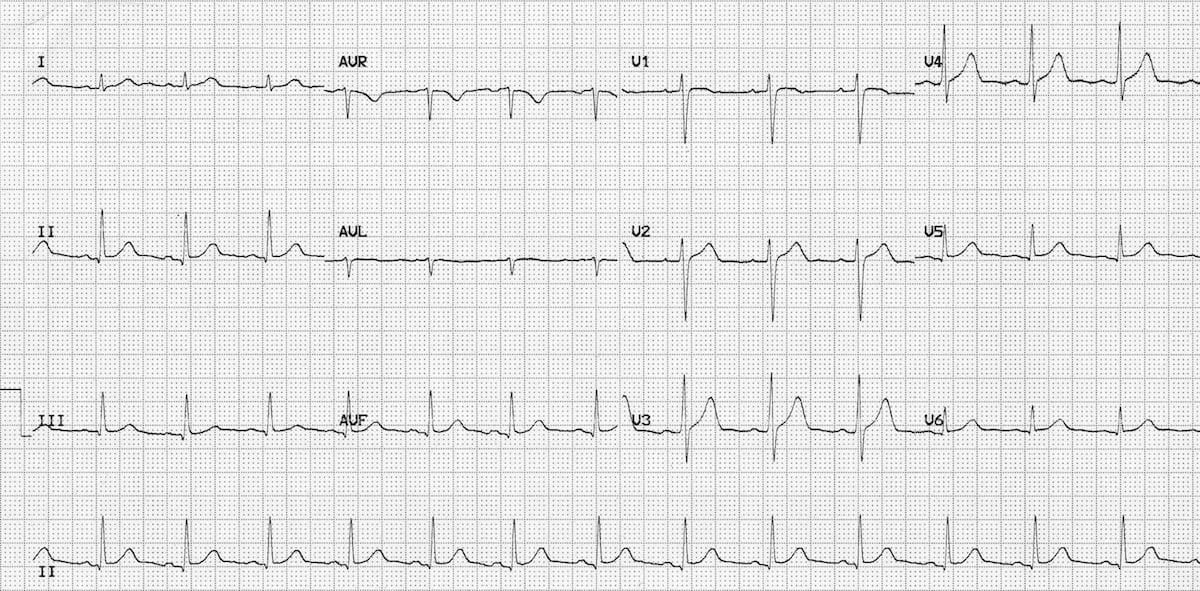
A normal ECG. The longer version of II at the bottom is called the ‘rhythm strip’.
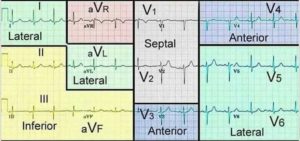
Let’s start with the regions of the heart. This is how the 12 leads ‘look’ at different areas of the heart.
Regions of heart

Rate
Normal heart rate is 60-100 bpm
Rhythm
The QRS complex is regular, and each follows a p wave. This is called sinus rhythm.
Axis
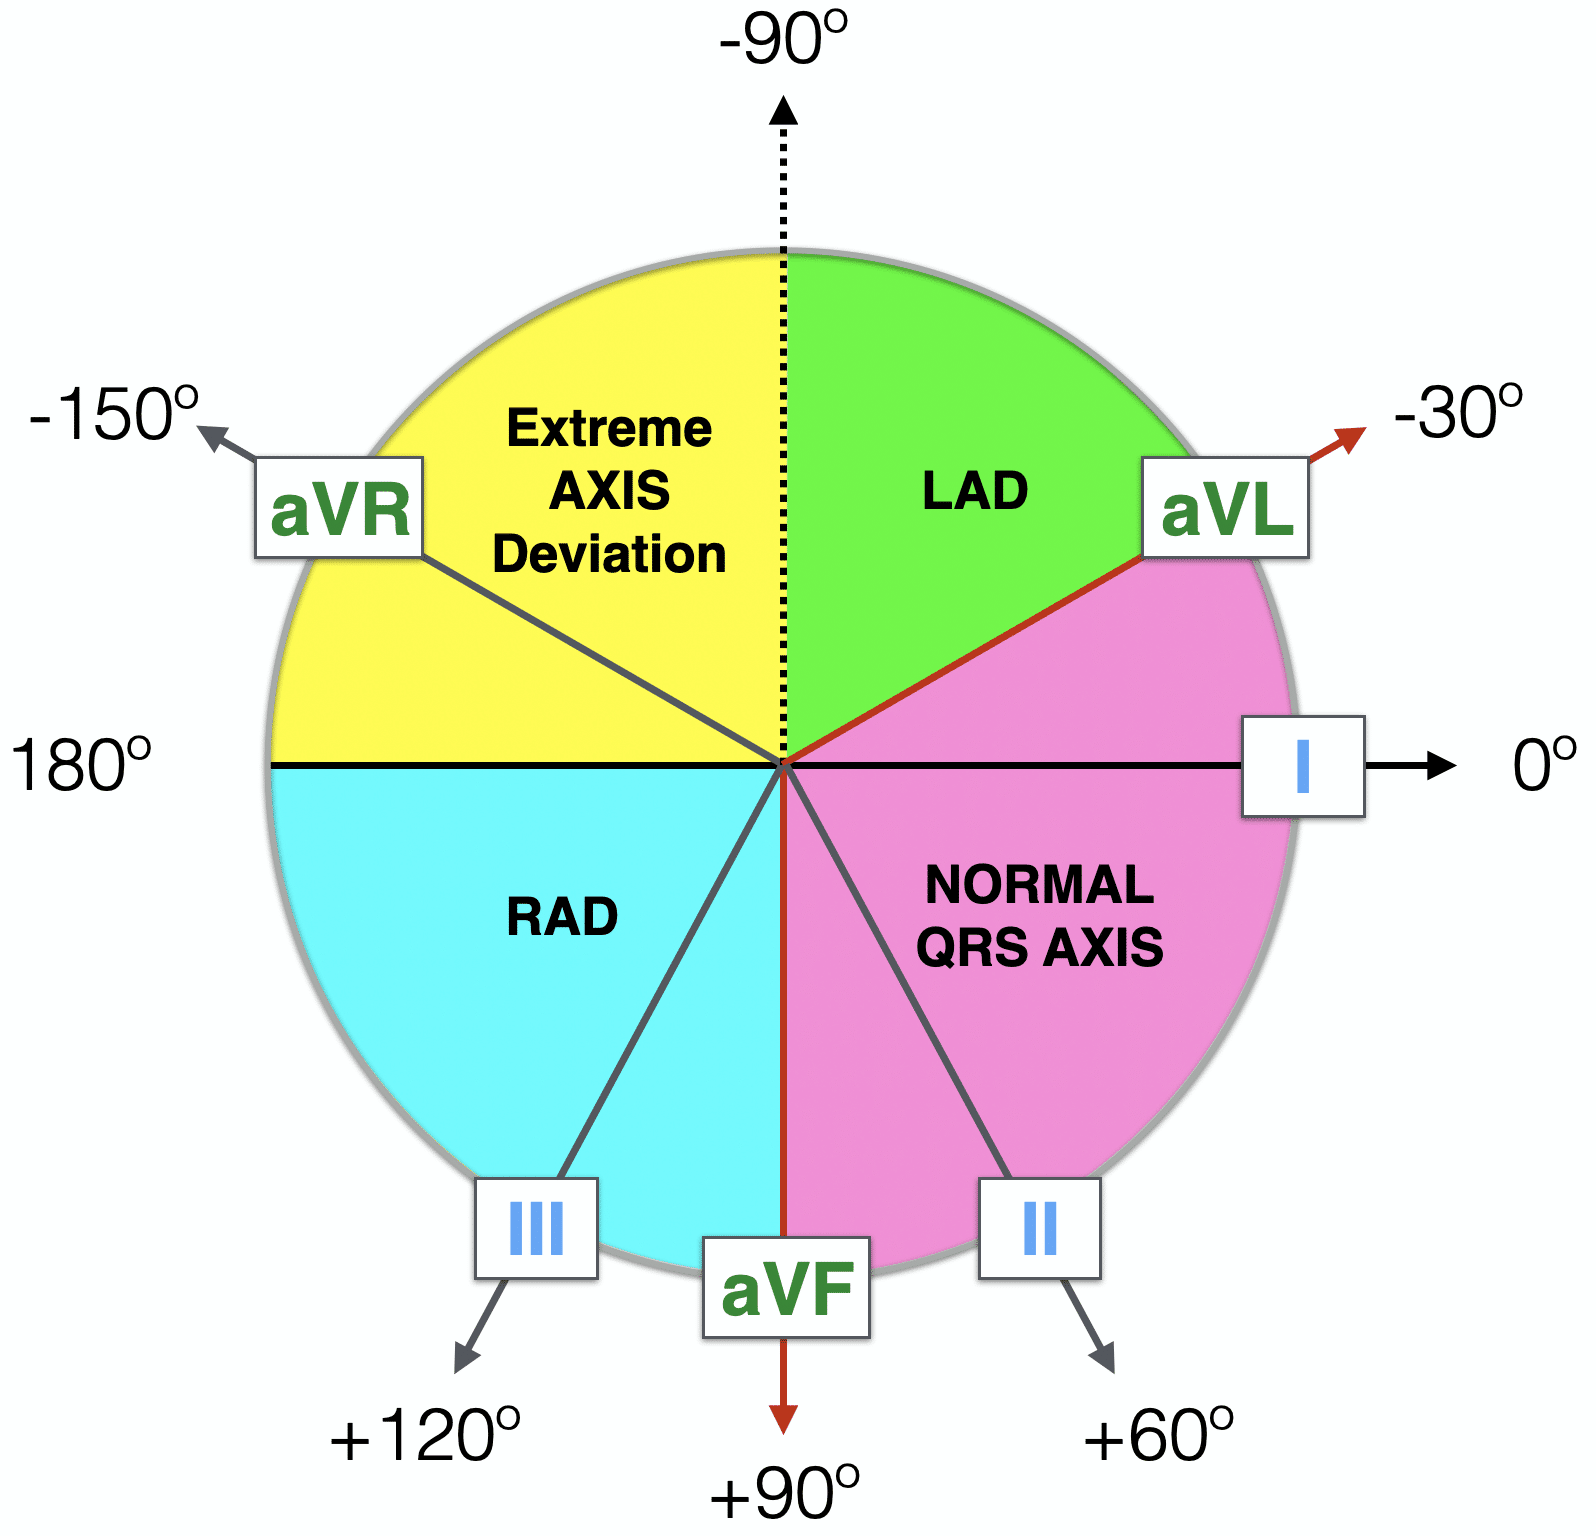
Normal Axis = QRS axis between -30° and +90°

Run through of components of ECG
1. P waves
A normal P wave is present and upright, and <2.5 mm (2.5 small squares) high and <3 mm (3 small squares) wide
2. PR interval
Normal PR interval = 3-5mm (5 small squares).
3. Q waves
A small Q wave (2 mm (2 small squares or less) is present and downward in most leads (except V1-3, where they are always pathological).
4. QRS complex
- Width = <3mm (3 small squares)
- Height = <5mm (5 small squares) in the standard (limb) leads or <10 mm in the chest leads.
5. ST section
A normal ST section is flat and on the isoelectric line.
6. T waves
A normal T wave is present and most are upright (I, II, aVF, aVL, and V2-6).
7. Q-T interval
Normal QT interval is 9-11 mm (small squares).
Summary
We have demonstrated a normal ECG, and been through the basics. We hope it has been helpful.

